
Fed Governor Christopher Waller’s dovish remarks have added fuel to speculation of interest rate cuts, just as political pressure mounts on Jerome Powell. That could take the wind out of the US dollar’s recent rebound and open the door for EUR/USD and GBP/USD to embark on recoveries of their own.
View related analysis:
- USD Positioning Hints At Sentiment Extreme: COT report
- US Dollar Rallies as Tariff Tensions Rattle Markets and Risk Appetite
- US Dollar Index Climbs for 10th Day as Inflation Data Undermines Fed Cuts
Waller's Dovish Turn Undermines USD Strength as EUR/USD, GBP/USD Eye Rebounds
To the suspicious-minded, it could appear that Christopher Waller has thrown his hat into the ring to replace Jerome Powell—should the opportunity arise. And it just might, if President Trump succeeds in ousting Powell from the Federal Reserve’s top job.
In a speech titled “The case for cutting rates now”, Waller’s timing could be seen as in poor taste, given the public pressure Powell is currently facing from both Trump and Treasury Secretary Scott Bessent. Unless, of course, Waller is indeed after Powell’s job—in which case, the title and timing are perfect.
Waller described the potential inflationary impact of Trump’s tariffs as a “one-off increase” in prices, and therefore unlikely to cause persistent inflation. He also argued that policy should be considered close to neutral rather than restrictive, noting that growth is expected to soften to around 1%, private-sector employment is near “stall speed”, and labour market downside risks are increasing.
As a voting member of the FOMC, Waller’s comments carry weight. And it’s becoming increasingly clear that there is pressure—political or otherwise—on the FOMC to begin cutting rates. That could take some of the sting out of the US dollar’s recent rebound over the near term.

US Dollar Index (DXY) Technical Analysis
The US Dollar Index (DXY) recorded its 11th consecutive bullish daily candle this week—a potential warning of mean reversion ahead. A bearish divergence has also formed on the daily RSI (2), which recently dipped from overbought territory. With the rally now stalling beneath the 99.00 handle, traders may want to watch for confirmation of reversal patterns across other USD forex pairs.
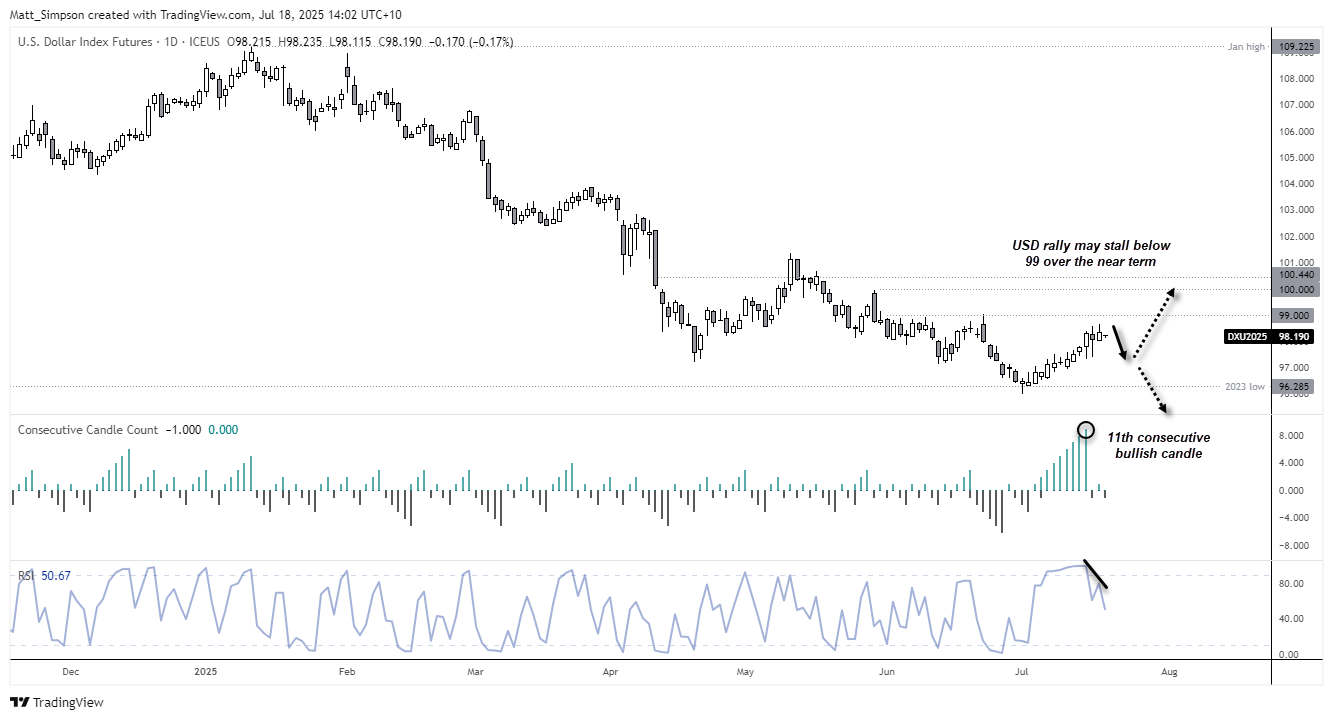
Chart analysis by Matt Simpson - data source: TradingView U.S. Dollar Index Futures
EUR/USD Technical Analysis: Euro vs US Dollar
The euro remains in a strong uptrend on the daily chart and has outperformed the British pound in recent weeks. Although EUR/USD is currently trading below the 20-day EMA, it is showing signs of support near the April high. Importantly, the 2-day RSI hit its most oversold level since October on Tuesday, and a bullish divergence has since formed.
This pattern suggests the euro to US dollar currency pair may have already printed a swing low, setting the stage for a near-term rebound that could pressure the US dollar index.
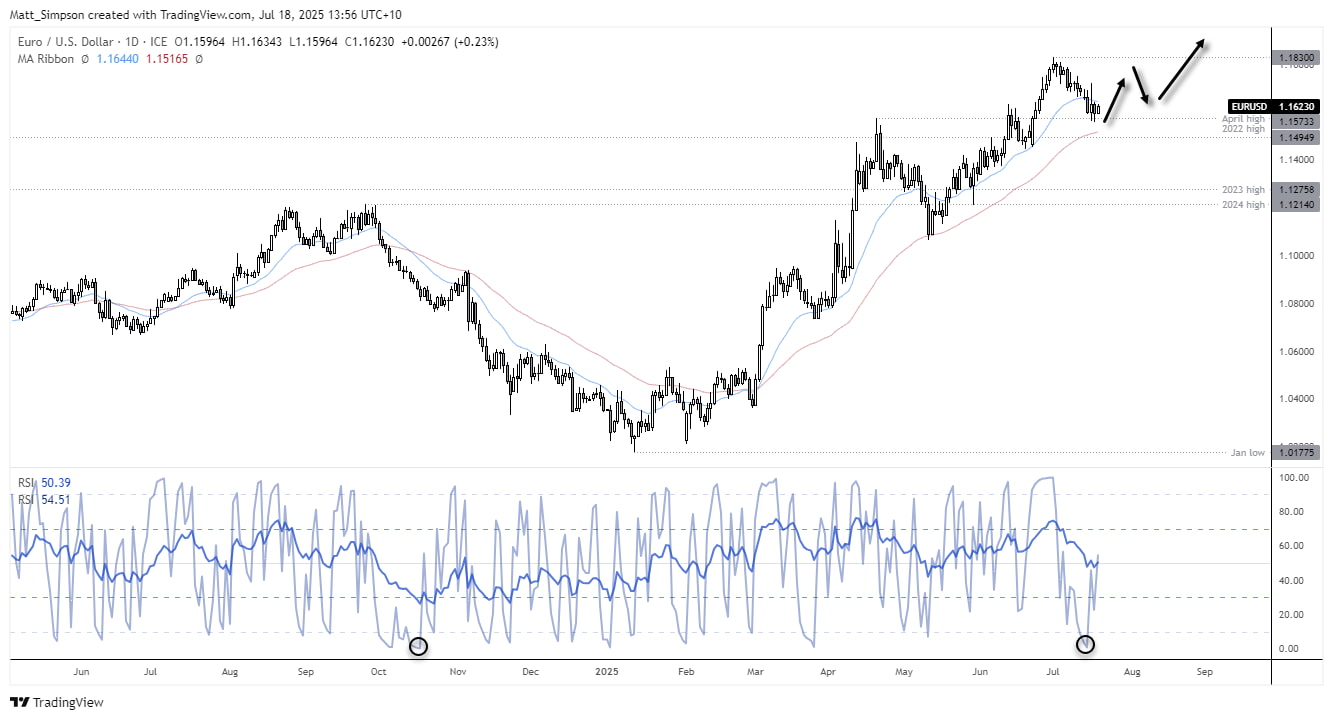
Chart analysis by Matt Simpson - data source: TradingView EUR/USD

Futures Positioning Supports Bullish Case for the Euro
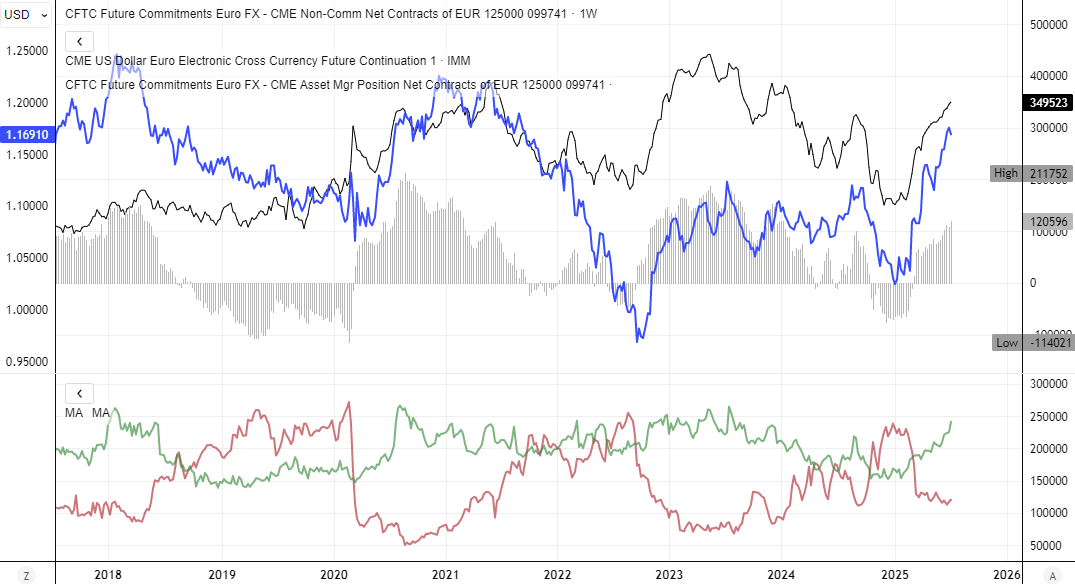
But there’s also a case to be made for the euro to break to new highs. Not only does pressure appear to be building within the Federal Reserve to cut rates, but EUR/USD futures positioning also supports a bullish outlook for the euro. Net-long exposure is trending higher among both large speculators and asset managers, while gross-long positions are rising and gross-short positions remain subdued. This suggests that any dips in the euro vs US dollar may prove shallow.
![]()
Chart prepared by Matt Simpson - data source: CME Futures, London Stock Exchange Group (LSEG)
GBP/USD Technical Analysis: British Pound vs US Dollar
The British pound (GBP/USD) suffered its sharpest decline since April, as renewed speculation of Bank of England (BoE) rate cuts pressured the currency. A daily close below trendline support confirmed a breakdown in the bullish channel from the January low, increasing the downside risk for the GBP/USD currency pair.
Momentum indicators such as RSI(2) were deeply oversold before an inverted hammer formed on Wednesday’s candle, hinting at a potential short-term rebound for the British pound against the US dollar.
Bulls may seek to buy dips near the June low, targeting a move towards 1.3500. A break above that level could expose the high-volume node (HVN) around 1.3600. However, failure to hold above recent support may see the GBP/USD pair test the May VPOC at 1.3287 and possibly the May low.
Overall, the technical setup for GBP/USD points to a potential short-term bounce, but broader sentiment still favours downside for the British pound vs US dollar.
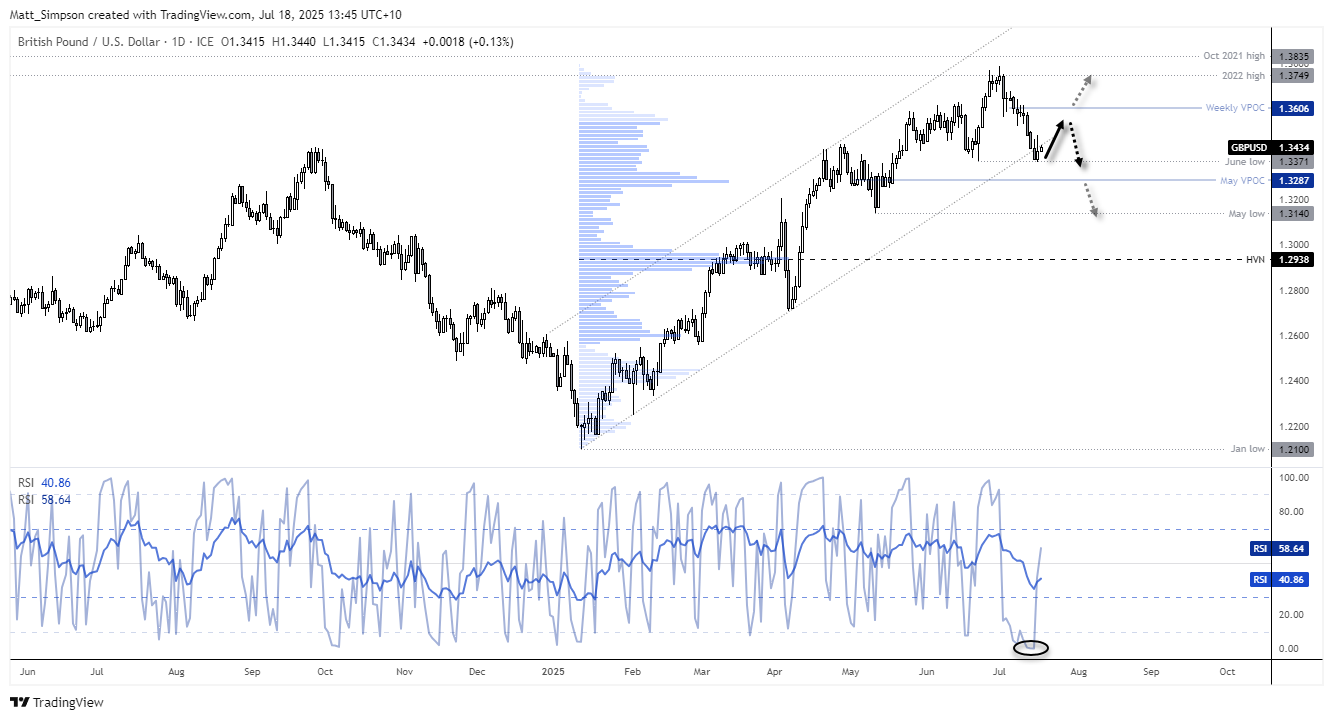
Chart analysis by Matt Simpson - data source: TradingView GBP/USD